|
sigmaplot是一个专业的科研绘图软件。《Science》、《Nature》中大部分图表都是出自SigmaPlot之手。很多下载安装了sigmaplot的人都知道,无论哪个版本的sigmaplot都有很多漂亮的例图。这些图是怎么做出来了。现在我们一步一步为大家讲解,文章源于www.soilhome.in。希望大家点评。数据和图形大家安装sigmaplot中的samples--sample graphs文件夹里。也可以从下面下载: 数据文件 图片文件
步骤
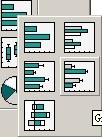
1。打开数据。选择horizontal bar chart→grouped horizontal bar chart。第二列第二个。
grouped
2.进入add plot --error bar对话框。属性设置如下图:symbol value--row means;error calculation-都选着standard deviation
diviation

3.data format 选择Y,x replicates---下一步---select data中
- Y : 1-Groups
- Start Set 1: 2-1.1
- End Set 1: 11-1.10
- Start Set 2: 12-2.1
- End Set 2: 21-2.10
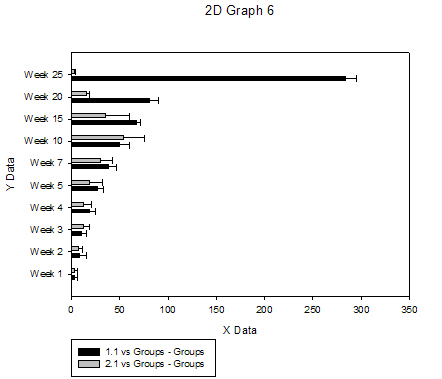
4.完成后初步成图如下
出图
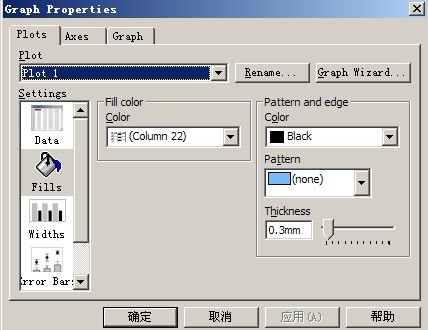
5.双击图形或者右键---graph properties进步图形属性里。plots--fills--fill color ---column22
column22
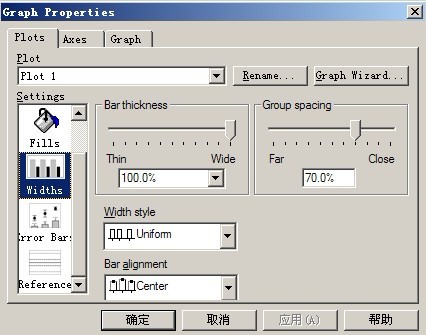
6。widths设置。bar thickness 选为wide(100%);group spacing 调为70.0%。可自由调节。
width
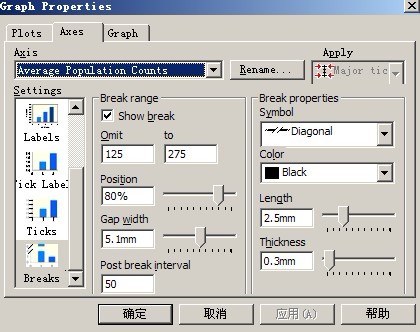
7.设置坐标轴:细心的朋友一定注意到graph properties分为三栏:plots、axes、graph。设置坐标轴肯定是在Axes里。 分别将x轴rename为Average Population Counts,将y轴rename为times。设置x轴是break:将break range 设置为omit 125 to 275,positive设置个80%就可以 了。其实至于设置为多少大家可以自己调试。
break
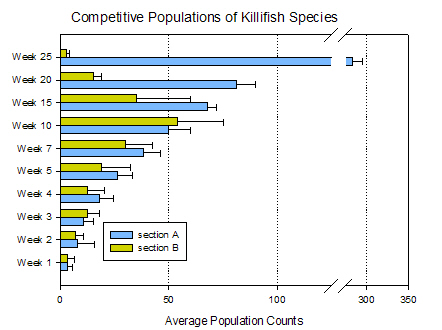
8.在graph里设置坐标轴的网格线:graph---grid line--x major--line properties style--dotted。就可以了。将graphrename为Competitive Populations of Killifish Species,并移动到合适的位置。将图标更名为section A、section B。并一定到合适位置。 去掉y轴的time。完美成图。如下:
最后
|